WTF: How Twitter's 'Who to Follow' Service Works
· 13 min read · System Design · Recommendation Systems · Graphs
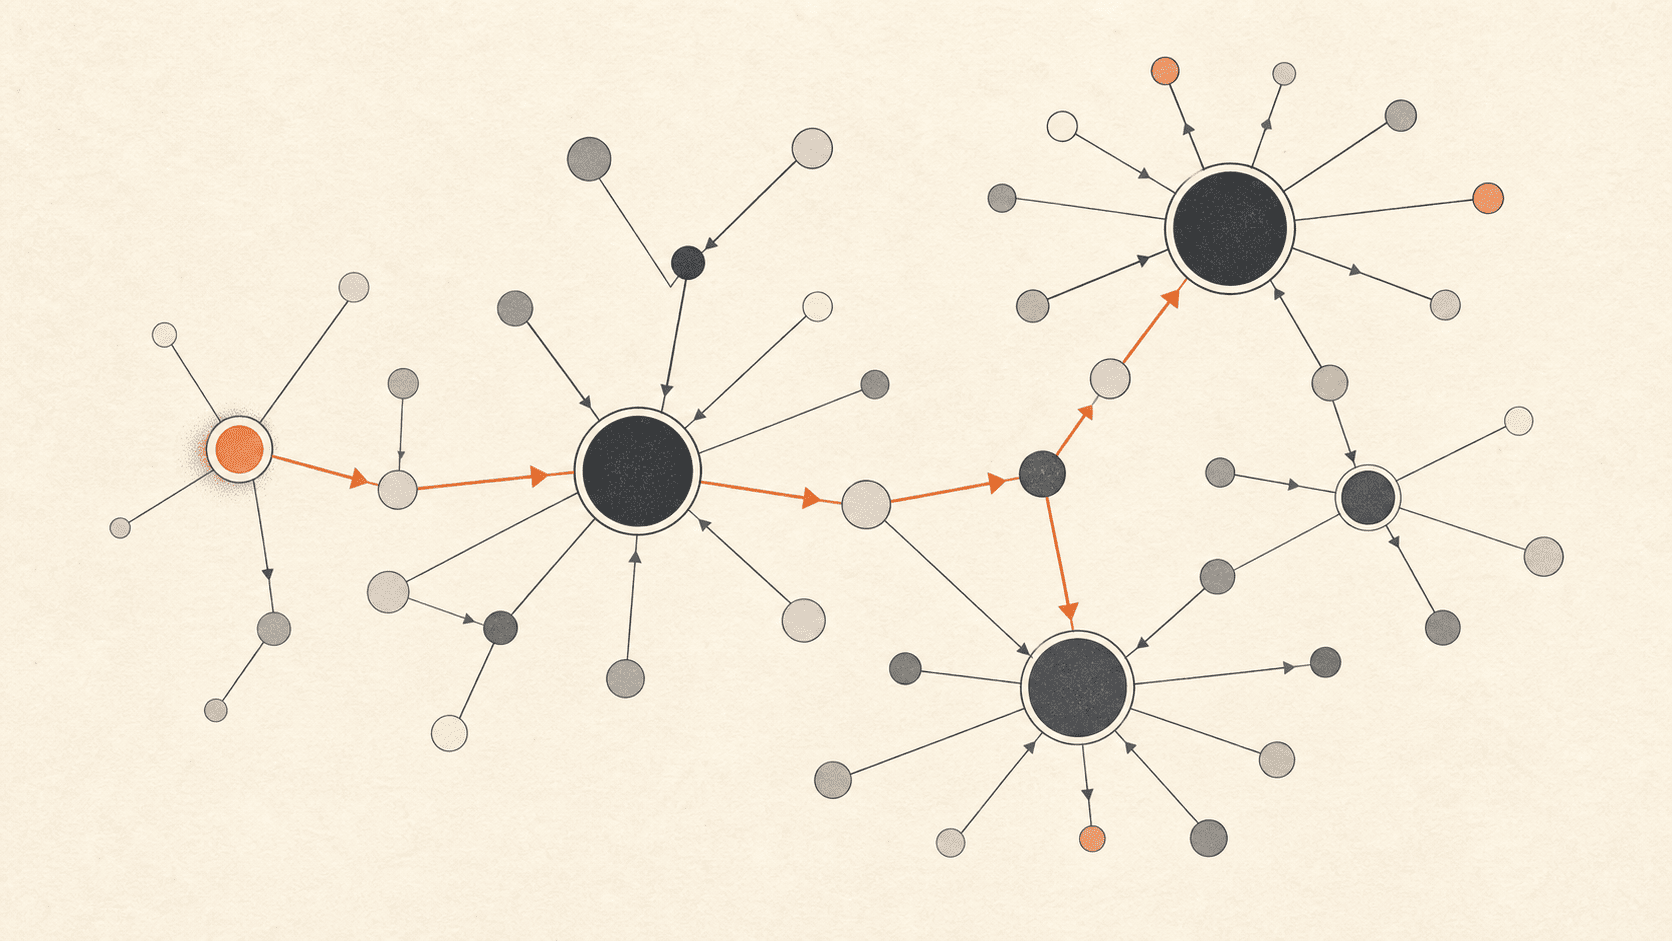
Graph structure, not machine learning
Most recommendation systems today start with machine learning. Twitter's first one didn't. It used graph theory.
WTF ("Who to Follow") started in spring 2010 with three engineers, launched that summer, and went on to create millions of connections between users every day. The first version found those connections from the shape of the follow graph alone, using random walks and an algorithm called SALSA. Machine learning came later, in a second version built on Hadoop.
Two kinds of recommendation
The paper splits "who should you follow?" into two questions.
- "Interested in": you care about a topic, so an account that posts about it is a good fit, even if you share nothing else with that account.
- "Similar to": accounts that follow the same people tend to be alike, a pattern called homophily. If someone is similar to you, the accounts they follow are good suggestions for you too.
Quick classification game
Interested in, or similar to?
1. A cricket fan does not follow @espn yet. Should the system suggest it?
2. You and @priya follow the same 40 developers and 12 design accounts.
3. A basketball lover follows @NBA. The system suggests @WNBA.
4. Two photography accounts follow almost the same people, so they are shown as "similar to each other" on their profiles.
Follows form an interest graph
Each user is a node, and each follow is a directed edge that points from the follower to the account they follow.
Follows are one-way. You can follow someone who never follows you back, so the edges record what people are interested in, not who their friends are. That is why the paper calls Twitter's graph an interest graph rather than a social graph. By August 2012, it held over 20 billion edges between active users.
Interactive graph model
The interest graph
You follow a few people; everyone follows someone.
Click any account to see who they follow. The arrow points in the direction of the follow.
Why one machine beat a cluster
In 2010, most of the industry was moving to distributed systems. Twitter went the other way: WTF held the entire follow graph in the RAM of one server, with no partitioning and no traffic between machines.
The team had two reasons.
A cluster would have to split the graph, and this graph splits badly. Follower counts follow a power law. A few accounts have huge audiences, and one had over 28 million followers. Wherever you place an account like that, most of its edges cross to other machines, and every crossing edge costs a network hop during a random walk.
The graph fit. The team planned for servers with 72 GB of RAM. Stored as plain pairs of 32-bit IDs, each edge takes 8 bytes. With 64 GB for the graph and 8 GB left for the operating system and the engine, one server could hold about eight billion edges. In practice, adjacency lists brought the cost down to about five bytes per edge, so that estimate was cautious. Growth models gave them 24 to 36 months before memory became a real problem, and the team later moved to servers with 144 GB.
Interactive design decision
One machine, or many?
WTF chose a single in-memory server. Move the slider to grow the graph and to see the design break.
Single in-memory server
chosen in 2010Fits in RAM — queries are microsecond in-memory reads.
Simple to build and debug, millisecond latency. But it has a hard ceiling: when RAM runs out, you are stuck.
Distributed cluster
industry default1 server
Scales with the graph — add machines as it grows.
But it adds partitioning, replication, coordination, and network latency. More moving parts to fail.
At 20M accounts the single machine still wins: simpler to build, deploy, and debug. That is the decision WTF made.
I think this was the right call, and the paper says why. It was a planned stopgap. The team knew the design had a ceiling and knew roughly when they would hit it. In return, they shipped a product Twitter badly needed in a few months, without first solving graph partitioning.
Twitter built the engine, Cassovary, from scratch for WTF and open-sourced it in March 2012. Its queries start from a single vertex. It stores each adjacency list as an array of primitive integers, and it runs random walks to approximate personalized PageRank.
Fault tolerance came from copies, not partitions. Every server in the Cassovary fleet loaded the full graph, so adding a server added capacity, and losing one lost nothing.
The bet was that the follow graph would grow more slowly than the RAM in a commodity server. It held for long enough to ship. The design ended when the graph, and the extra data the team wanted on each edge, outgrew a single server.
Step 1: find your circle of trust with a random walk
A walker starts at @you and hops to a random account that you follow. From there it keeps hopping, and now and then it jumps back to @you. After many hops, the accounts it visited most often form your circle of trust.
Interactive algorithm demo
Random walk → circle of trust
A walker hops from @you to a random follow, tallying every visit.
Visits so far
Step 1 / 12: Start at @you
Every walk begins at @you.
Cassovary ran this walk from scratch on every request. The results were always as fresh as the latest daily graph snapshot, and other products could change the walk's settings for their own needs. Twitter search and discovery used the circle of trust as a service, for example, to rank content from accounts in your circle higher.
Step 2: rank candidates with SALSA
SALSA takes your circle of trust and builds a two-sided graph. The left side, the hubs, holds about 500 of the top-ranked accounts from your circle. The right side, the authorities, holds the accounts that those hubs follow. The authorities are your candidates.
Interactive algorithm demo
SALSA — the two-step walk
Hubs on the left, authorities on the right. Each pass redistributes scores across the edges.
Step 1 / 5: Build the bipartite graph
The hubs are on the left. They are your circle of trust: @alice, @bob, @carol. The authorities are on the right. They are the accounts that the hubs follow: @dan, @erin, @finn. Every node starts with an equal score.
Each SALSA step crosses two links: one from a hub to an authority, and one back. So a walk that starts on the hub side always ends on the hub side, and a walk that starts on the authority side always ends there too.
After several rounds, both sides have scores. The ranked authorities become your "interested in" recommendations. The ranked hubs are the accounts most similar to you, and their ranking feeds the "similar to you" feature.
SALSA was first built to rank web pages, and it belongs to the same family of random-walk algorithms as PageRank and HITS. Twitter's change was to build the two sides from one user's circle of trust, so every result is personal.
Recommendations refresh all day, not overnight
The graph itself is loaded only once a day. Reloading it more often would put too much load on the production databases. Recommendations still change throughout the day, because Cassovary servers work through a queue that holds every Twitter user, sorted by when each user's recommendations were last refreshed. Each server takes the next user, generates about 100 recommendations in under 500 ms per thread, writes them to a MySQL database called the WTF DB, and puts the user back at the end of the queue.
Interactive system demo
The cold-start queue
Users wait to be refreshed. New users jump the line.
Refresh queue — front first
Step 1 / 5: The refresh queue
Existing users wait for a new scan and new recommendations. The queue serves the front first.
Two kinds of users skip ahead. Active users who have used up their recommendations, or soon will, move to the front, and they usually get new ones within an hour.
New users move to the front too, which deals with the cold-start problem: a new account has almost no follows to walk. In the common case, a new user sees suggestions before they finish the sign-up flow. WTF also ran a separate set of real-time algorithms for new users. These algorithms read from Cassovary and from FlockDB, the database that holds the live follow graph, so they could use follows made after the last snapshot.
How Twitter measured it
Offline tests replayed old graph snapshots and checked whether the algorithms predicted follows that happened later. The real test was online A/B experiments, which tracked two numbers:
- Follow-through rate (FTR): the share of shown recommendations that users followed.
- Engagement per impression (EPI): how much a user engaged with an account after following it.
The paper is candid about FTR. FTR measures precision but not recall. It favours new users, who follow more accounts anyway. It also counts every follow the same, whether that account improves your timeline or not. EPI gets closer to what Twitter wanted, but you only get it after a waiting period, so it slows down each experiment.
Production never ran one algorithm by itself. The standard version blended results from about 20 algorithms. An endpoint called the Blender merged those results, sent them to the web and mobile clients, ran the A/B tests, and recorded the feedback.
Why the second version moved to Hadoop
The team knew from the start that the single-server design had two weaknesses. The first was memory: the graph would eventually outgrow one server. The second mattered more. There was no room to store extra data on each edge. In the 8-byte layout, adding one 8-bit weight to every edge costs another 12.5% of memory. That ruled out timestamps, interaction counts, and profile data, which are the signals better algorithms need.
The second version of WTF dropped Cassovary and ran entirely on Hadoop, with every algorithm written in Pig. It starts from a graph the paper calls the "Real Graph", which lives on HDFS, not in memory. Its edges carry weights and interaction signals such as retweets, favorites, and replies.
The new pipeline has two stages:
- Candidate generation: graph algorithms produce a short list of promising accounts, aiming for recall and variety.
- Rescoring: a logistic regression model, trained with stochastic gradient descent, ranks those candidates for precision.
What to remember
- Graph structure alone produced good recommendations. Machine learning came in the second version.
- Holding the whole graph on one server was a planned stopgap with a known lifespan, and it let three engineers ship in a few months.
- The random walk finds your circle of trust. SALSA ranks the accounts that your circle follows.
- Reliability and scale came from full copies of the graph, not from partitioning.
- The graph refreshed daily. Recommendations refreshed all day through a queue, and new users went to the front.
- Production blended about 20 algorithms, and the team judged them by FTR and EPI from A/B tests.
Paper: WTF: The Who to Follow Service at Twitter by Gupta, Goel, Lin, Sharma, Wang, and Zadeh (WWW 2013).